Infographic: How High is the Price of Gas?
Infographic: How High is the Price of Gas?

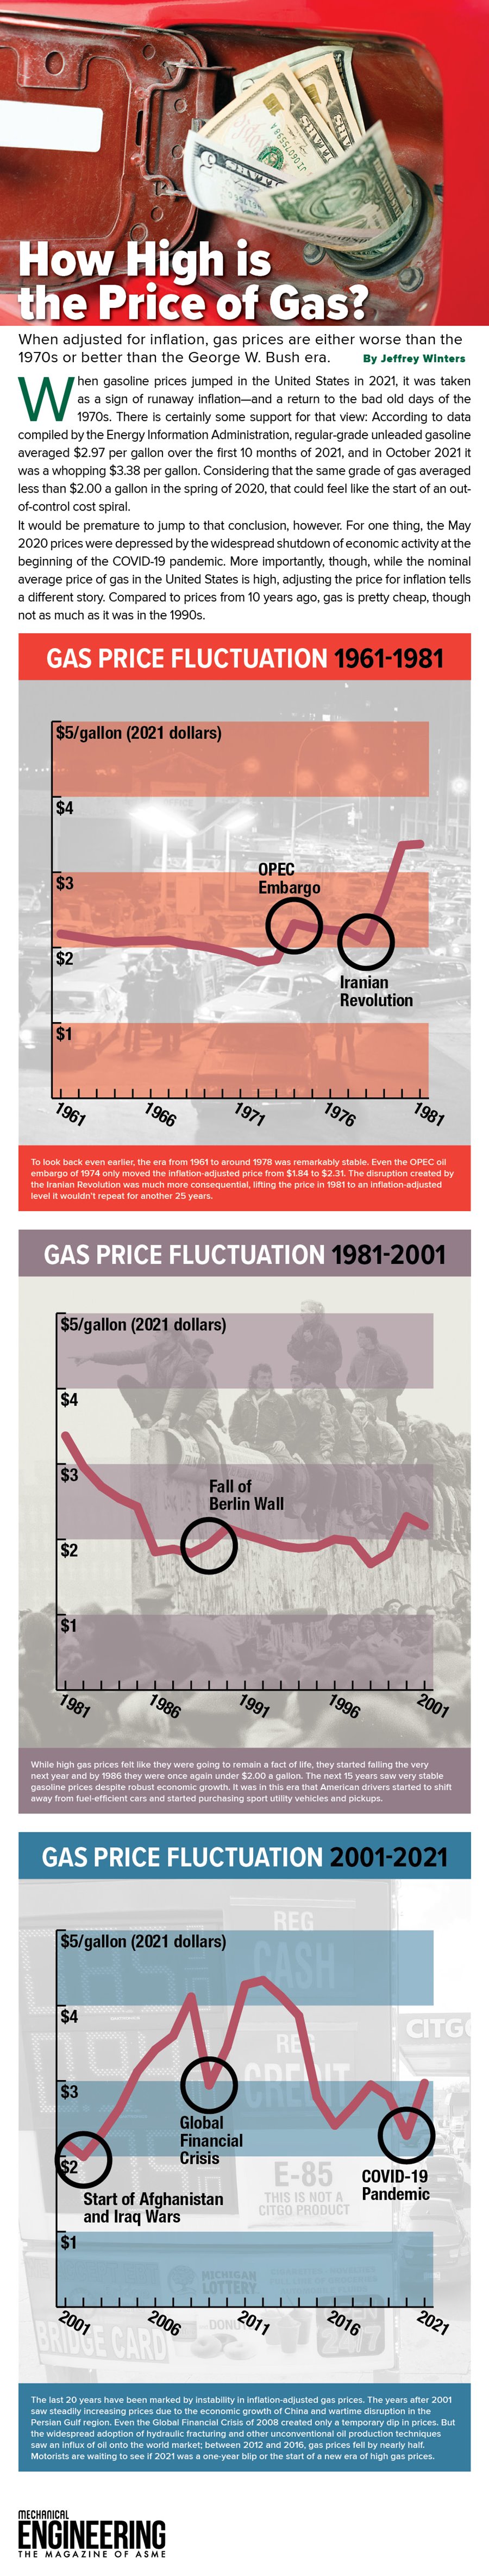
Gasoline prices may feel expensive, but when adjusted for inflation, they are either worse than the 1970s or better than the George W. Bush era.
When gasoline prices jumped in the United States in 2021, it was taken as a sign of runaway inflation- and a return to the bad old days of the 1970s. There is certainly some support for that view: According to data compiled by the Energy Information Administration, regular-grade unleaded gasoline averaged $2.97 per gallon over the first 10 months of 2021, and in October 2021 it was a whopping $3.38 per gallon. Considering that the same grade of gas averaged less than $2.00 a gallon in the spring of 2020, that could feel like the start of an out-of-control cost spiral.
It would be premature to jump to that conclusion, however. For one thing, the May 2020 prices were depressed by the widespread shutdown of economic activity at the beginning of the COVID-19 pandemic. More importantly, though, while the nominal average price of gas in the United States is high, adjusting the price for inflation tells a different story. Compared to prices from 10 years ago, gas is pretty cheap, though not as much as it was in the 1990s.
It would be premature to jump to that conclusion, however. For one thing, the May 2020 prices were depressed by the widespread shutdown of economic activity at the beginning of the COVID-19 pandemic. More importantly, though, while the nominal average price of gas in the United States is high, adjusting the price for inflation tells a different story. Compared to prices from 10 years ago, gas is pretty cheap, though not as much as it was in the 1990s.
Related Content

Wearable Patch Offers Voice to the Voiceless
Apr 18, 2024
A thin self-powered patch can sense the movement of laryngeal muscles and translate those movements into audible speech.

Energy Blog: Noticeable Eclipse Impact on Electricity Sector
Apr 17, 2024

Breakthrough Could Make for Long-Range EVs
Apr 16, 2024
A simple method could lead to electric vehicles that can go much father on a single charge, and batteries that last years longer than present technology.

Quiz: What Do You Know About Jet Engines?
Apr 12, 2024
Jet engines power aircraft of all sizes and help knit the world together. Test your knowledge of this essential technology in our ASME quiz.